
The Department of Defense recently released its Defense Spending By State Report for FY2020. In the report, it highlights and breaks down two aspects of spending: prime-/sub-award contract and personnel/payroll. Overall, the DoD spent $593.9 billion in FY2020; that expenditure was broken down into $439.4 billion for contracts and $154.6 billion for personnel/payroll.
While money went to all 50 states and D.C, the amount each state received varied widely. It ranged from a low in Wyoming of $456.4 million to a high in Texas at $83 billion. In looking at the report data, 10 states received 61% of the money spent.
Top Ten States – Total, Contracting and Personnel/Payroll
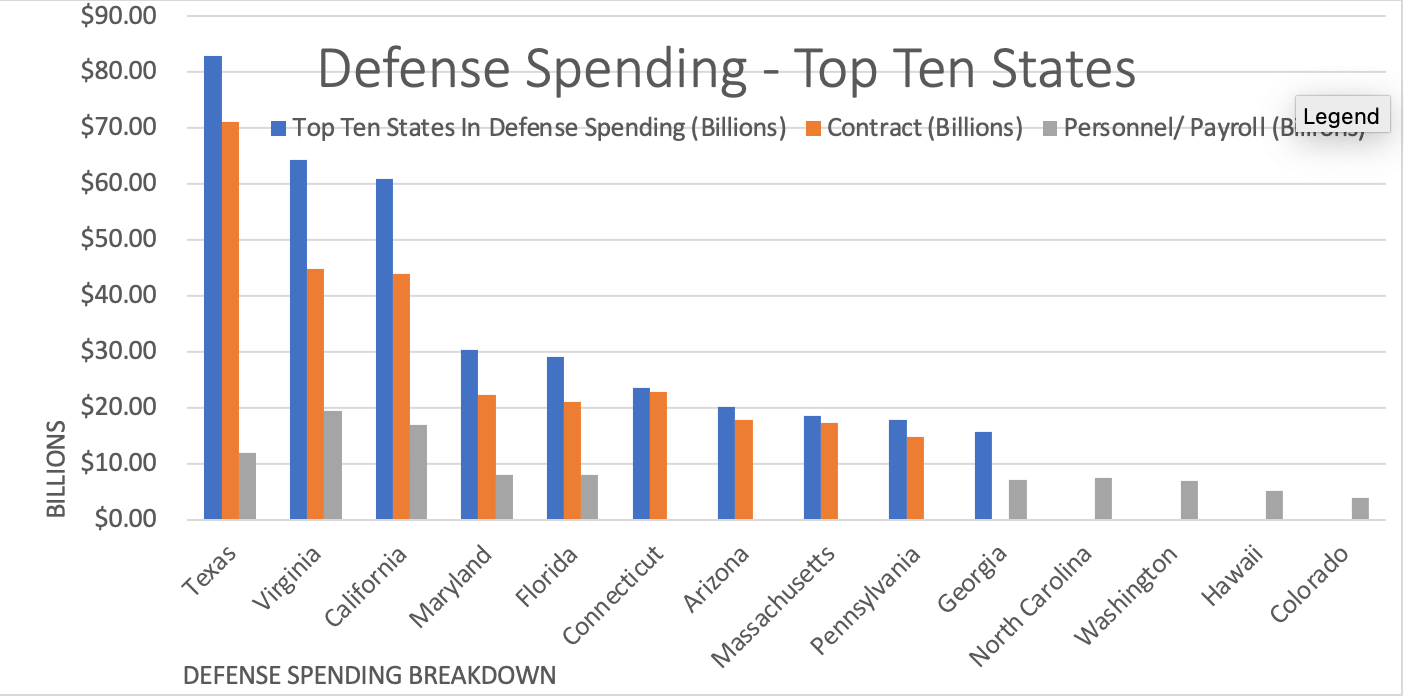
While most states received either contract or personnel/payroll money as depicted above, five states received their fair share of both:
- Texas
- Virginia
- California
- Maryland
- Florida
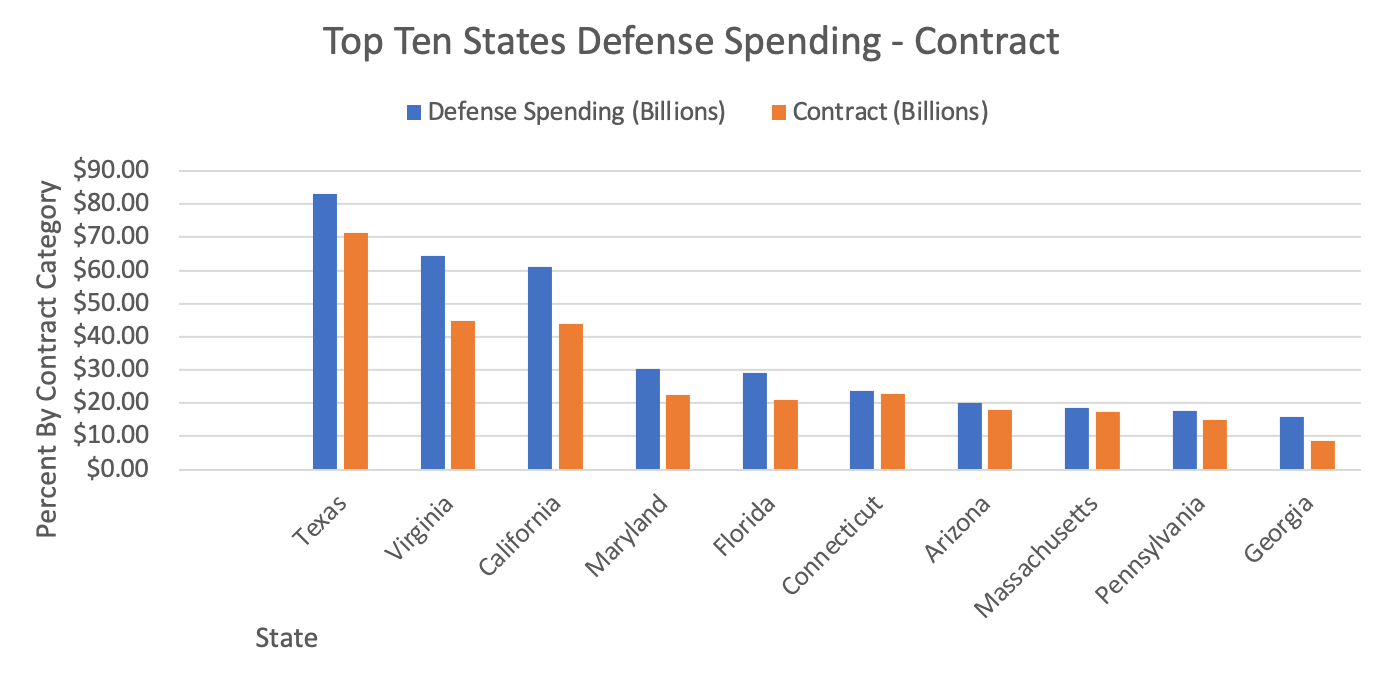
Contract Spending Breakdown
The $439.4 billion the DoD spent on contracts, was spent on:
- Supplies and equipment – 54%
- Services – 34%
- Research and development – 7%
- Construction – 5%
The majority of the contract funds DoD spent went to ten states. The chart below not only shows the ten states, but also the role contracting played in the overall DoD dollars coming into their state.
Some defense contractors had more impact in some states than others. The six main contract recipients in the top ten states were:
- Lockheed Martin
- L3Harris Technologies
- Raytheon
- General Dynamics
- Northrup Grumman
- Booz Allen Hamilton
Of those six, these four had the most impact within those states:
| Defense Contractor | TX | VA | CA | MD | FL | CO | AZ | MA | PA | GA |
| Lockheed Martin | x | x | x | x | x | x | x | x | x | x |
| Raytheon | x | x | x | x | x | x | ||||
| General Dynamics | x | x | x | x | x | x | x | |||
| Northrup Grumman | x | x | x | x | x | x |
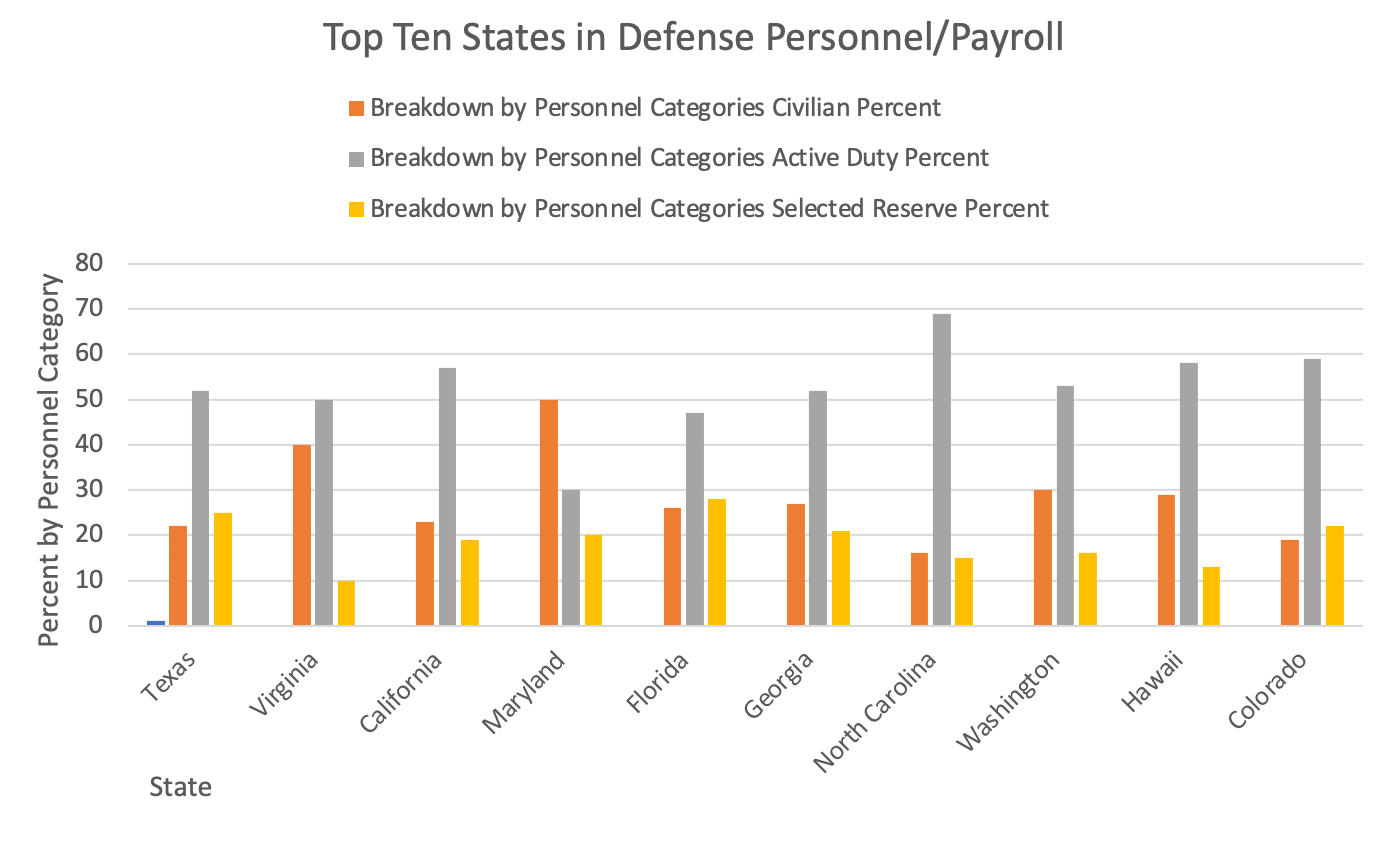
Personnel/Payroll Breakdown
The DoD spent 154.6 billion on personnel and payroll in these three categories:
- Active Duty – 46%
- Civilians – 40%
- Selected Reserves (National Guard and Military Branch Reserves) – 14%
Of the money spent, ten states received a total of $95 billion. The chart below breaks down the spending according to type of personnel. While most of the states listed showed the majority of their money coming from active duty pay, the anomaly was Maryland where 50% of its defense personnel/payroll dollars come from civilian employees.
Effect on State GDP
Another interesting fact is to the extent the money received from defense spending impacted each state as far as their GDP. While the average for all states and D.C was 2.8%, the impact ranged from a high of 11.3% in Virginia to a low of 0.6% in Oregon. But the dollars received did not necessarily correlate to the state’s GDP.
For example, while Texas received the greatest amount of defense dollars at 14.0%, it only accounted for 4.6% of their state’s GDP, while Alaska’s 3.4% in defense dollars received was 6.4% of its GDP.
Defense Spending Per Resident
Another breakdown in the report was the amount per person received when the defense dollars were factored against the population of each state. The District of Columbia had the highest per person amount at $10,690 per person, while Idaho had the least at $379 per person. It is interesting to note that while Texas received 14.0% of the total defense dollars spent, it had a lesser effect on the per resident amount of $2,828 per individual. On the other hand, the District of Columbia received 1.3% of the defense dollars spent, but the effect per resident was $10,690.
Overall, the DoD spent $593.9 billion in FY2020, which was an 8% or $43 billion increase over what it spent in FY2019. This was due to a 9% increase in contracts and a 5% in personnel/payroll. And while $593.9 billion sounds like a lot of money (and it is), it represents only 2.8% of our Nation’s GDP.


